Graph: Making Physical Retail Measurable
Transforming static retail displays into data-generating platforms for global product manufacturers.

Role
Founder & CEO
Industry
IoT / Analytics
The Problem
Blind spots in physical retail ROI.
The Output
Enterprise Dashboard & Edge HW
The Problem
While e-commerce was built on a foundation of rich interaction data, physical retail remained a "black box." Brands invested billions in endcaps and retail fixtures but had no visibility into how customers actually engaged with their products before the point of sale. Endcaps were premium marketing real estate operating without a feedback loop.
The Solution: Interactive Shelving
Graph transformed static displays into interactive platforms. By embedding low-cost, connected tablets into retail fixtures, we created an interface where shoppers could explore features and compare models. Every touch was a data point.
- Feature Engagement: Tracking which product specs mattered most to shoppers.
- Engagement Duration: Measuring the "dwell time" that leads to conversion.
- A/B Testing Physical Space: Comparing display performance across different geographic markets.
Scale & Partnerships
The core of Graph’s success was proving that interactive, measurable retail could operate at scale. We deployed across major retail environments with a roster of global hardware and service brands.
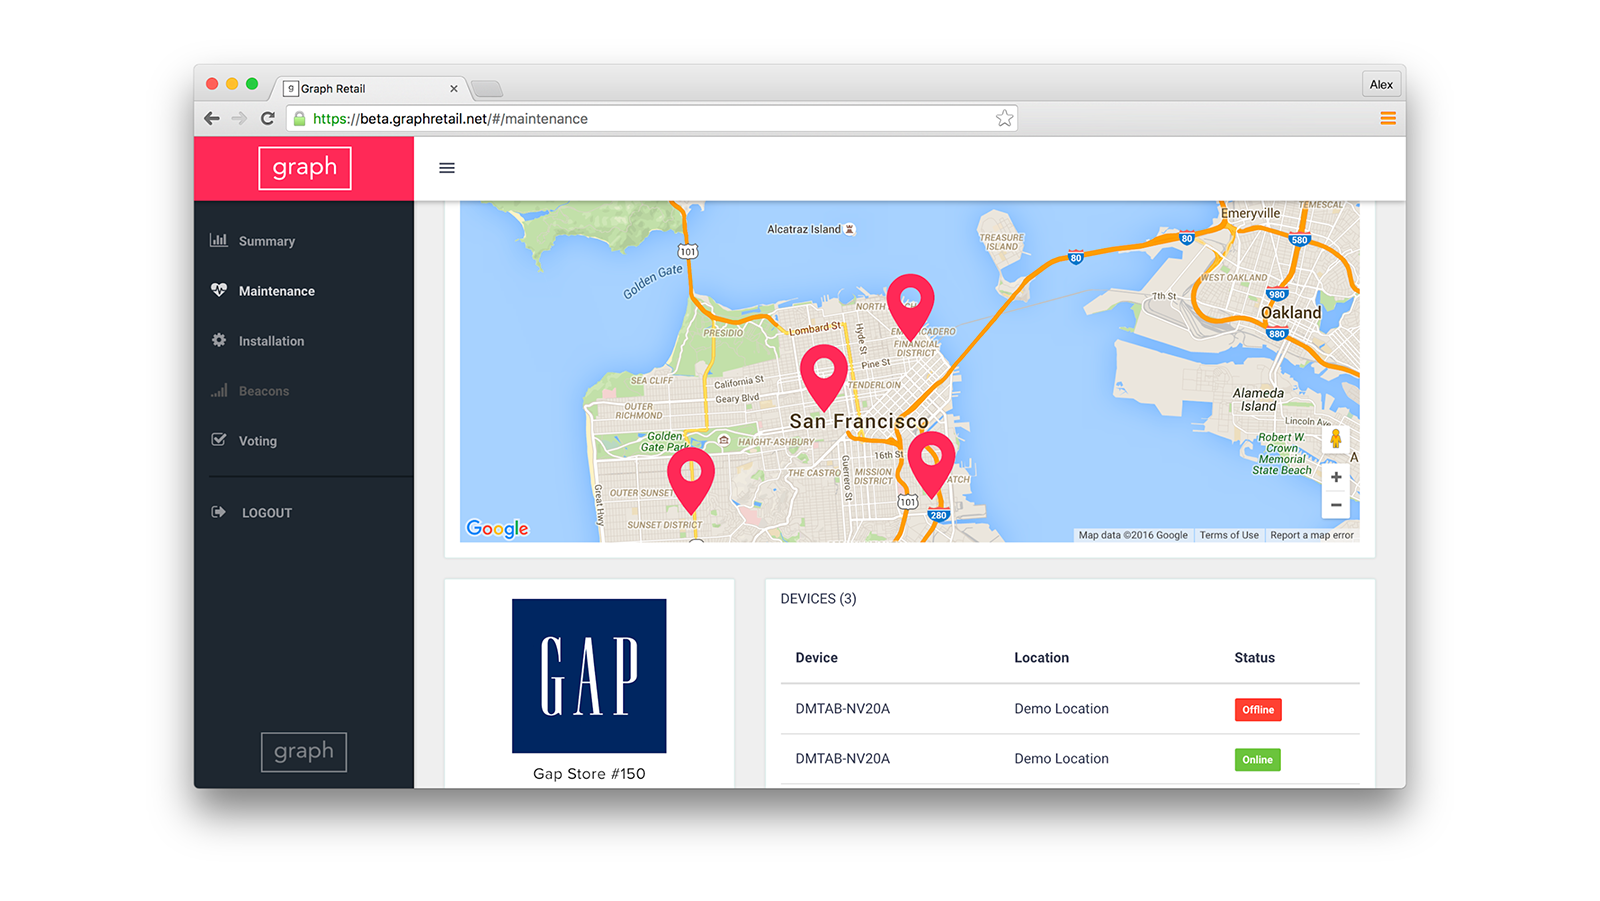
Dashboard UX
The product wasn't just the hardware in the store—it was the Analytics Dashboard for the brand managers. I designed a web-based portal that translated complex sensor data into actionable insights: geographic breakdowns, feature-level interest, and point-of-purchase sales correlations.
Legacy & Impact
Graph anticipated the shift toward Retail Media Networks and in-store attribution. It proved that physical infrastructure is programmable and that UX determines whether a data signal exists: if a customer doesn't interact, the system stays silent.